

Big SQL Energy Beginner Course: Lesson 27 Data Models & Fact vs. Dimension Tables

Got BDE?⚡️
Hi BDEs! Welcome to Lesson 27 of the free Big SQL Energy Beginner Course⚡️ Today we’re learning about Data Models & Fact vs. Dimension Tables in SQL!
Return to Big SQL Energy Beginner homepage here to access the other lessons:
If you’re new here:
💁🏽♀️ Who Am I?
I’m Jess Ramos, the founder of Big Data Energy and the creator of the BEST SQL course and community: Big SQL Energy⚡️. Check me out on socials: 🔗LinkedIn, 🔗Instagram, 🔗YouTube, and 🔗TikTok. And of course subscribe to my 🔗newsletter here for all my upcoming lessons and updates— all for free!
⚡️ What is Big SQL Energy?
🔗Big SQL Energy Intermediate is an intermediate SQL course designed to solve real-world business problems hands-on using realistic data and a modern tech stack. You’ll walk away with 2 SQL portfolio projects, portfolio building guidance, access to the Big Data Energy Discord community, and lots of confidence for you upcoming coding interviews! You also get access to all monthly events including masterclasses, office hours, and guest speakers. This course is all of the most important things I’ve learned on the job as a Senior Data Analyst in tech who grew from a $72K salary to over a $150K salary. And now I’m sharing it with YOU! It’s more than just another course— it’s a challenging program designed to upskill your SQL to the intermediate level, get ready to ace your live coding interviews, and build connections in the data community through the Discord and events.

Lesson 27: Data Models & Fact vs. Dimension Tables
Today we’re talking about one of the sexist parts of Data Analytics: Data Documentation 🥵🔥😮💨 and a hint of Data Engineering with fact & dimension tables!
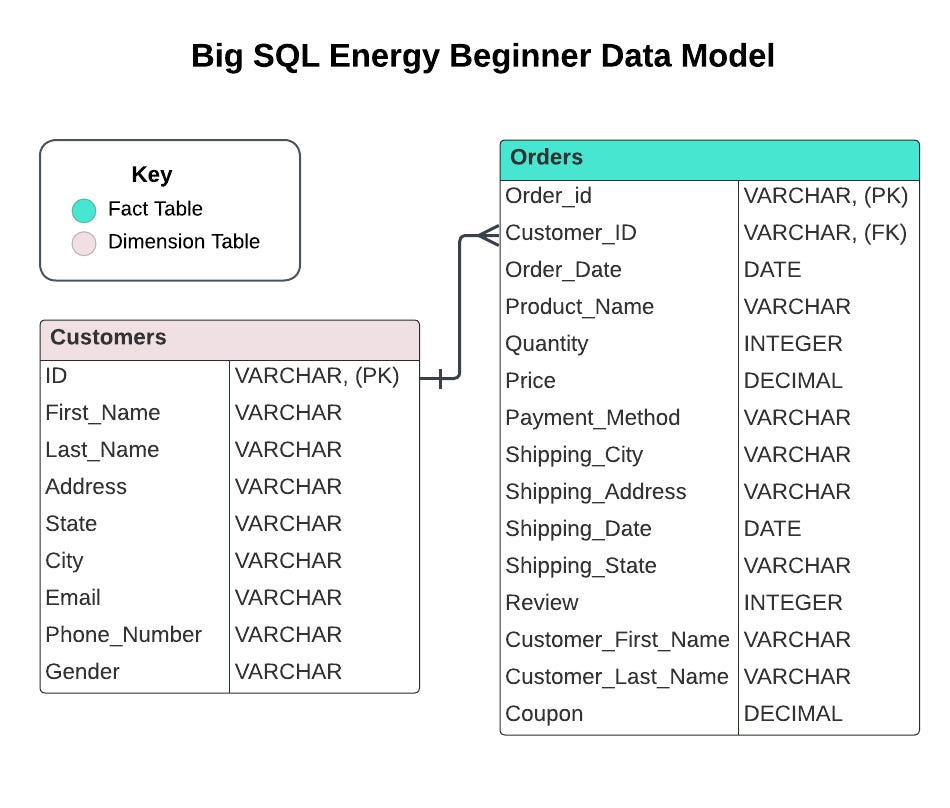
🔗Grab the Big SQL Energy Beginner Data Model here
Data Models
In the real world, data isn’t just a brain dump of random information thrown into a database. (Ok maybe in a startup it feels like that LOL) Data is created (or should be at least) craftily and thoughtfully in a database. It should be designed in a way that uses minimum storage but also balances the ease of querying for front-facing data people like data analysts. There’s a lot of tradeoffs when it comes to database design, but it’s really important because it can affect the company’s overall costs and the people who are querying the data daily.
Data models are a map of all the tables in the database and how they’re connected to other tables in the database. They show the columns in each table, the data type of each column, and label the primary key and foreign keys in each table. These are golden things to have for people who are joining together multiple tables and trying to find certain information.
Tables can have different kinds of relationships between them based on the keys they’re connected on and how the data model was designed. Understanding these relationships and granularities is essential for combining datasets with joins!
The relationships between tables can be:
One-to-one (1:1): each row in a table can only connect to or relate to one row in another table and vice versa.
Ex. A People table and a Driver’s License table. Each person can only have one driver’s license and each driver’s license can only be assigned to 1 person.
One-to-many (1:M): each row in one table can connect to or relate to multiple rows in the other table.
Ex. A Teachers table and a Students table. In a classroom, there is one teacher with multiple students and multiple students for each teacher. (Pretend it’s not possible for there to be multiple teachers in a classroom!)
Many-to-many (M:M): each row in one table can connect to or relate to multiple rows in the other table and vice versa.
Ex. Bank account data. Each bank account can have multiple people on it (think joint accounts), and people can also have multiple bank accounts.
Below is the (very small and simple) data model for the Beginner Big SQL Energy course. The 🔗Intermediate Big SQL Energy course has a much larger and more realistic data model with over 15 tables!
Dimension vs. Fact Tables
Dim vs. Fact tables are a hot topic in Data Engineering because they’re essential when it comes to understanding how to model data and build relationships between them. Although I’ve never been an official data engineer, in the startup world, you wear a lot of hats. So I’m no stranger to putting on my DE hat to make views in the database or even to build an entire data model in Power BI.
At the start of my career, I broke MANY data models in Power BI. And I mean MANY! LOL! Version control is important ok 🤣 Power BI was a great way for me to learn the difference between a Dim table and a Fact table and how they can work together to create magic for reporting and querying. So if you want to dabble and get started, build a data model in Power BI. It’s a great visual way to learn the ropes!
You definitely need to understand what’s different about Dim vs. Fact tables to understand the relationships between them. This gets really important when it comes to writing queries in SQL because you need to know how tables are connected. Do they have a 1:1 relationship? 1:M (1 to many)? If you don’t know these answers, you may do some CRAZY SQL joins and end up with missing data or extra data in your output.
So what’s the difference??
Dim vs. Fact Difference
Talking about Dim & Fact tables is easiest by comparing them:
Dim tables contain descriptive data and fact tables contain quantitative data.
Dimension tables are tables that contain unique values whereas fact tables are tables that contain allll of the data.
Dimension Tables are used to filter, describe, and add context to fact tables.
Dimension tables are usually smaller, while fact tables are usually larger.
Fact tables generally have columns that serve as foreign keys and link to (or join to) the primary keys of the dimension tables.
Want me to explain it to you like you’re 5? 🍔🌮 🍕
In the simplest terms possible, a dimension table is like a menu that displays all the options (burger, taco, pizza, etc.) and a fact table is like a list of all the orders (52 burgers, 900 tacos, 34 pizzas, etc.). 🍔🌮 🍕
Now that I’m hungry talking about pizza, let’s talk about some examples:
Fact Tables:
Orders
Subscriptions
Event Log
Status Log
Web Traffic
Dim Tables:
Product
Customer
Users
Event Definitions
Employee
There are so many more real-world examples in the 🔗Intermediate Big SQL Energy course!
Fact tables usually carry the bulk of the data and the detailed, granular data points (like transactions) that are used to create metrics and KPIs. But what good are those without context? Maybe you have X% for your metric, but what does that mean? That’s when you pull in your context (hello Dim tables) to add more value. We can pull in product IDs, customer names, and user emails to now provide more context to our metric. Without Dim tables, we’d be completely lost!
A lot of data analysts don’t know much about basic data engineering concepts like Dim and Fact tables, but data modeling affects all of our work so much since we’re always querying tables and connecting them together.
Understand what’s under the hood or get out of the driver’s seat!
If you’ve enjoyed the free BEGINNER Big SQL Energy course, grab my intermediate course. There are no deadlines or timelines for this course— you start and take as long as you want. It will take your beginner skills to the next level and get you ready to ace your interviews. DM me or email me at courses@bdeanalytics.com if you have questions on the intermediate course!
Return to Big SQL Energy Beginner homepage here to access the other lessons: