

Spotify Wrapped: Biggest Data Engineering & Machine Learning Project of the year 👀
It's not just a sexy marketing campaign


Got BDE?⚡️
Hi data baddies 💅🏼
I just launched my new SQL Interview Crash Course designed to teach you about the different interview formats, handle feedback and rejections, practice the most common conceptual/verbal AND live coding SQL questions.
Why Spotify Wrapped Isn’t a Just Marketing Campaign
Spotify Wrapped is a beautiful example of data storytelling and taking complex data and insights and turning it into something meaningful for users.
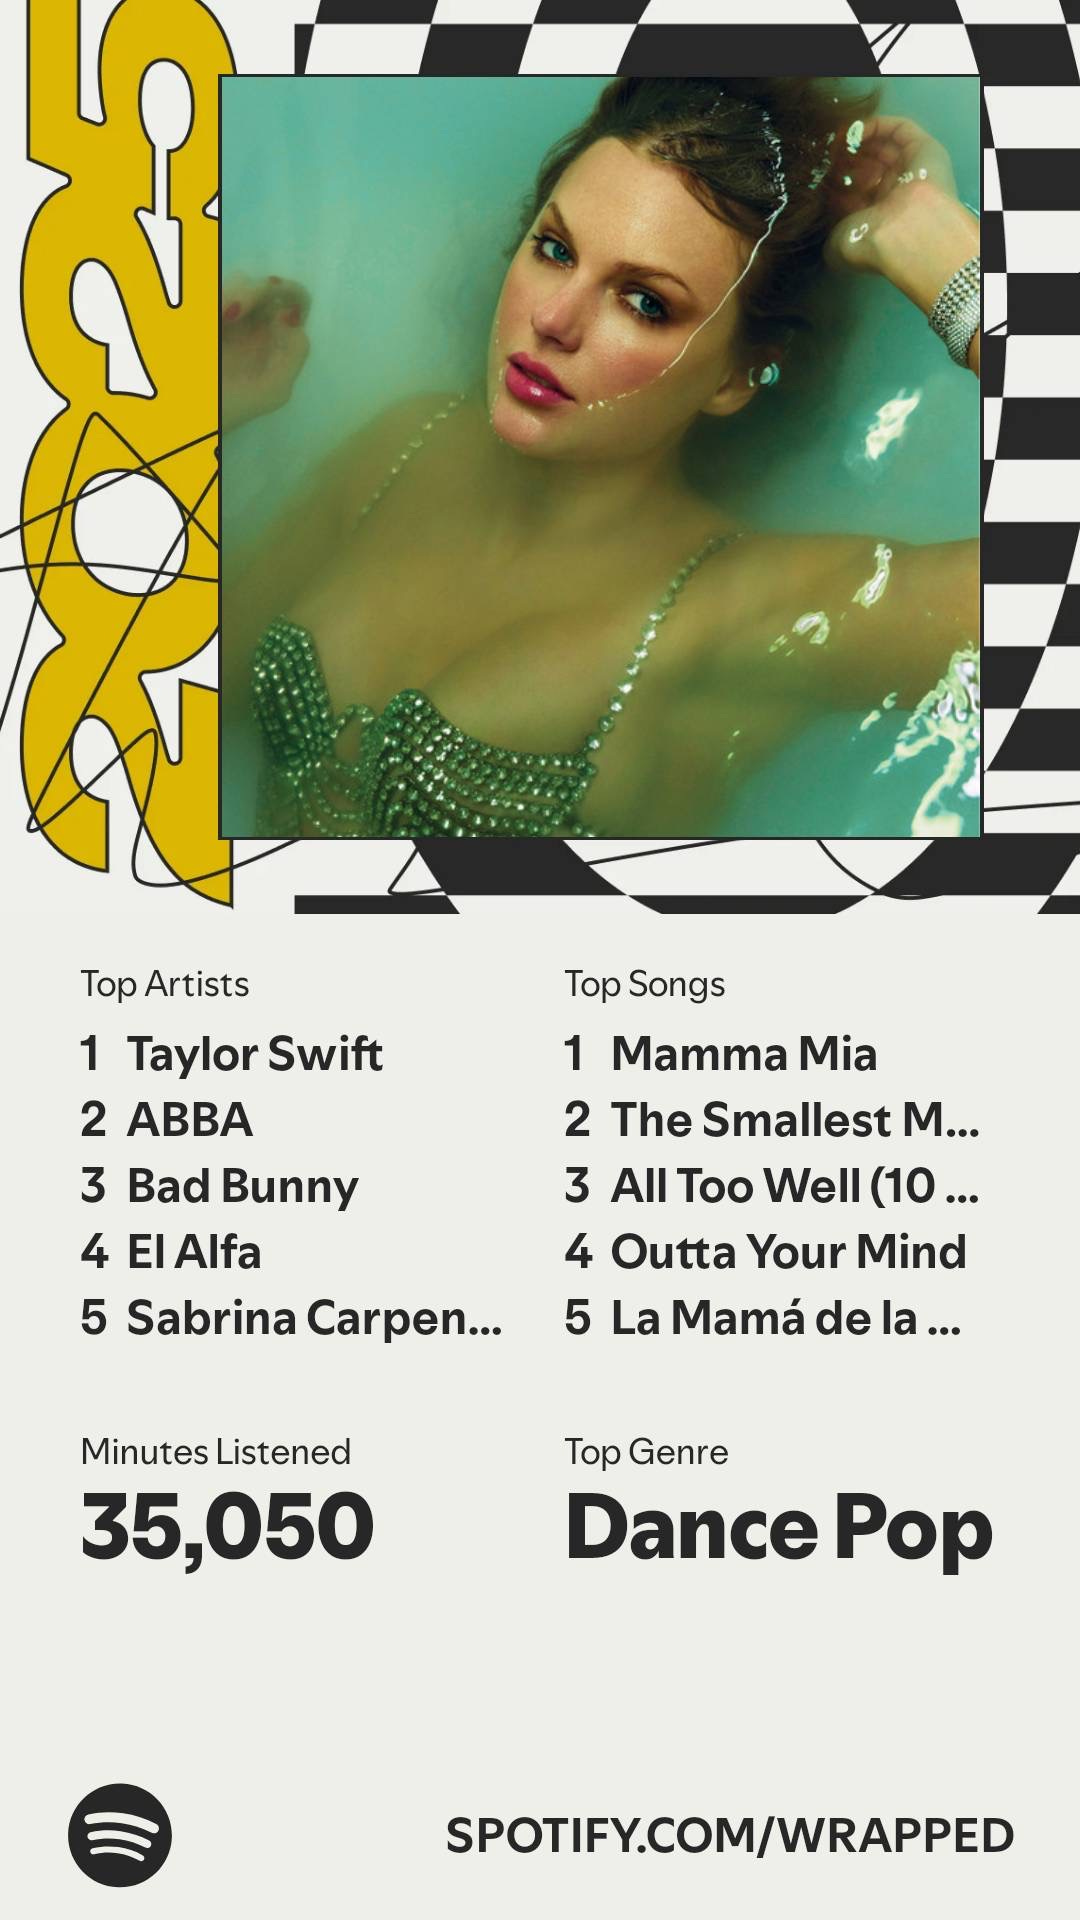
Every year around December, Spotify Wrapped🔗 shows up in all of our accounts, and it’s become a tradition we all look forward to annually.
Not only do we know our top songs & artists, but we also get personalized info like our music personality and listening age. It’s presented in brightly colored slides that feel strangely personal. Your favorite music plays on each slide, and you even get to see how high you rank with your favorite artists. And if you’re lucky, videos they pre-filmed for you!
Most people assume Wrapped is just good marketing and even make jokes about how simple it is to find the top X of something in SQL… I’m guilty HERE🔗 and HERE🔗 🤣
But the truth is much more interesting…
Spotify Wrapped is one of the largest, most complex data engineering and machine learning projects quietly running in production (all year long) for hundreds of millions of people.
(and yes, then it’s packaged beautifully at the end!)
And the only reason it works is because of some very deliberate technical decisions.
So let’s talk about them!
Data Collection
Spotify doesn’t “figure out” your Wrapped in December.
It’s collecting the data continuously over the entire year. Every time you do anything in the app (press play, skip a song, replay the same track for the 30th time) an event is fired. Each event is a structured data point describing what happened, when it happened, and who did it.
At Spotify’s scale w/ millions of users, that data adds up fast.
They use Apache Kafka to ingest hundreds of billions of events every single day, streaming them into a Google Cloud data warehouse. At this point, the challenge isn’t just storage. It’s computation. How do you even begin to process that amount of data?!
Joining the Data
Here’s where things get difficult computationally… Spotify needs to combine:
User behavior (what you listened to & everything you did)
Song metadata (genre, artist, audio characteristics)
Now imagine doing that join for ~500 million users with an entire year of behavior data. And they have to do it in a way that is (somewhat) cost-effective and that won’t crash.
So they use a technique called Sort Merge Bucket 🔗 (SMB).
Instead of joining everything at once, they pre-sort data by user ID, split it into buckets, and process each bucket in parallel. This means your Wrapped is computed at the same time as millions of others, but in an organized, predictable way.
The AI & Analytics
Once the data is joined, machine learning, AI, and analytics take over. Every song on Spotify has hidden numerical features (scale of 0 to 1) that are averaged and aggregated to create analytics like your vibe and listening age. For example:
Valence: how happy the song sounds
Energy: how intense it feels
Your “music vibe and age” is really just statistics & machine learning.
The Storytelling
The final step is the presentation— the part the user finally sees! Spotify uses Lottie files, which are lightweight, JSON-based vector animations.
They’re small, render fast, and don’t require streaming video— which is good because the internet would crash if Spotify tried to deliver all of these as video files at once.
Spotify Wrapped is a beautiful example of data storytelling and taking complex data and insights and turning it into something meaningful for users.
What do you think and who was your top artist??
Bye BDEs 💅🏼
Jess Ramos 💕
⚡️ Social Highlights:
⚡️If you’re new here:
💁🏽♀️ Who Am I?
I’m Jess Ramos, the founder of Big Data Energy and the creator of the BEST SQL course and community: Big SQL Energy⚡️. Check me out on socials: 🔗YouTube, 🔗LinkedIn, 🔗Instagram, and 🔗TikTok. And of course subscribe to my 🔗newsletter here for all my upcoming lessons and updates— all for free!
Been wanting to read an article on Wrapped for the longest time.
Thank you for the insights!
Love this! My top artist was Slow Coast, who self-describe as "SF beach rock"; I was in the top 0.06% of their listeners.